RAG Pipelines Miss Key Insights: How to Embed Tables, Charts, and Images

The Hidden Gap: Why Standard RAG Falls Short
Retrieval Augmented Generation (RAG) has transformed how large language models (LLMs) access and synthesize information, moving them beyond their training data limitations. Yet, a critical vulnerability persists: standard RAG pipelines are predominantly text-centric. They excel at processing prose, but falter when confronted with the rich, structured, and visual information embedded in tables, charts, and images. This oversight means that crucial insights, often contained in financial reports, scientific papers, or technical manuals, remain inaccessible to LLMs, leading to incomplete or even misleading responses.
The assumption that all relevant information can be linearized into plain text is fundamentally flawed in many enterprise contexts. Imagine a RAG system tasked with answering questions about a company's quarterly earnings. If the key revenue figures are buried in a complex table, or market trends are visually represented in a bar chart, a text-only RAG pipeline will either ignore this data or misinterpret a simplistic text description of it. This creates a significant gap between the perceived capability of RAG and its actual performance on real-world, multimodal documents, undermining trust and limiting the system's utility for high-stakes decision-making.
The Core Challenge: Semantic Loss in Non-Textual Data
The primary challenge with tables, charts, and images stems from their inherent structure and semantic density. When a table, for instance, is simply converted to a string of text, its relational context—the meaning conveyed by rows, columns, and their intersections—is often lost. A simple string concatenation like 'Q1 Revenue 10M Q2 Revenue 12M' lacks the clear structure of a two-column table where 'Q1' and 'Q2' are row headers for 'Revenue'. Similarly, a chart's visual patterns, trends, and comparisons are difficult to describe accurately and concisely in text without losing nuance.
Images pose an even greater challenge. A photograph or diagram contains an immense amount of visual information that is almost impossible to fully capture in a brief caption. While Optical Character Recognition (OCR) can extract text from images, it fails to interpret the spatial relationships, graphical elements, or overall visual context. This semantic loss during the conversion to plain text prevents the LLM from forming a complete understanding, leading to an inability to answer questions that rely on the original visual or structured format. The LLM, despite its intelligence, can only reason over what it perceives, and a flattened representation severely limits its perception.
Embedding Structured Data: Tables and Spreadsheets
To effectively handle tables, RAG pipelines must move beyond simple text extraction. One robust approach involves treating tables as structured data points rather than linear text. Tools like LlamaIndex's TableNode or LangChain's table-specific agents can parse tables, extracting headers, rows, and columns, and then re-serialize them into semantically richer text formats. This might involve generating a natural language summary of the table's contents, creating a markdown or CSV representation, or even generating multiple 'perspectives' of the table to capture different facets of its data.
Another powerful technique is to embed table-specific metadata alongside the table content. This means generating embeddings not just from the raw table data, but also from its schema, column names, and a brief natural language description of the table's purpose. Some advanced methods involve generating multiple embeddings for different parts of the table or using specialized models that understand tabular structures to create more robust representations. When a query comes in, the RAG system can then retrieve not just relevant text chunks, but also relevant tables, allowing the LLM to process the structured data in a more informed manner, often by passing the table directly to a model capable of interpreting structured inputs or by using an agent that can query the table dynamically.
Extracting Visual Insights: Charts and Images
Handling charts and images requires a multimodal approach, often leveraging Vision Language Models (VLMs) or specialized image processing techniques. For charts, the process typically begins with robust image processing to identify and extract graphical elements. This can involve using computer vision models to detect chart types (bar, line, pie), extract data points, and identify labels and legends. Once these elements are extracted, they can be converted into a structured text format, such as a JSON representation of the chart's data, which can then be embedded and retrieved. This granular data allows the LLM to 'see' the underlying numbers and trends, not just a high-level description.
For general images, the strategy often revolves around generating rich, descriptive captions or integrating multimodal embeddings. Advanced VLMs like OpenAI's GPT-4V or Anthropic's Claude 3 Vision can analyze an image and generate detailed textual descriptions, identify objects, or answer specific questions about its content. These generated descriptions, which can be significantly more informative than human-written captions, are then embedded into the vector database. When a query is made, the relevant image description is retrieved, providing the LLM with a nuanced understanding of the visual content. Furthermore, some cutting-edge approaches involve creating multimodal embeddings that represent both the image and its associated text, allowing for direct retrieval of image-embedding pairs.
Architecting Multimodal RAG Pipelines
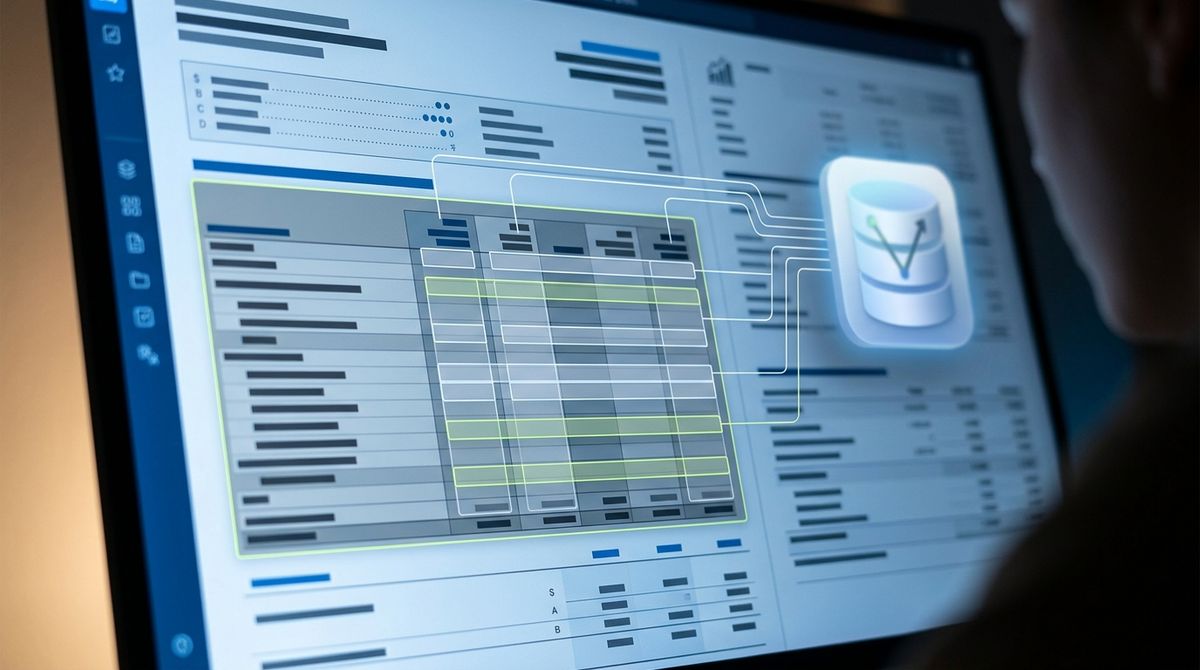
Integrating these advanced techniques requires a sophisticated pipeline architecture. The process typically starts with a robust document parser capable of identifying different content types within a document (text, tables, images). For each content type, specialized processing modules are invoked. Tables might go through a structured data extractor, images through a VLM for captioning, and plain text through standard chunking. Each processed chunk—whether it's a table summary, a chart's data points, or an image description—is then embedded using a suitable embedding model and stored in a vector database like pgvector or Pinecone, alongside metadata indicating its original source and type.
During retrieval, the user's query is also embedded. The RAG system then performs a semantic search across the entire vector database, retrieving not just text chunks, but also relevant table summaries, image descriptions, or chart data. An orchestration framework, such as LangChain or LlamaIndex, then takes these diverse retrieved contexts and intelligently synthesizes them before passing them to the LLM. This synthesis might involve reranking retrieved chunks, applying specific prompt engineering techniques for structured data, or even using an agentic workflow where the LLM can decide to 'look up' more details from a retrieved table if the initial summary is insufficient.
The Trade-offs: Cost, Latency, and Complexity
Adopting multimodal RAG introduces significant trade-offs, primarily in cost, latency, and system complexity. Utilizing advanced VLMs like GPT-4V for image captioning or chart analysis can incur substantial API costs, often priced per image or per token for the visual context, which quickly scales with large document corpuses. Furthermore, the processing time for these models is significantly higher than for text-only embeddings, adding latency to the indexing phase and potentially to real-time query responses. A simple text chunking and embedding might take milliseconds, while VLM processing for a single complex image could take seconds.
The increased complexity of the pipeline itself is another major consideration. Managing multiple parsing strategies, different embedding models for varied data types, and sophisticated orchestration logic demands greater development effort, more robust error handling, and more intricate monitoring. Debugging becomes more challenging when issues could stem from OCR inaccuracies, VLM misinterpretations, or faulty table serialization. This complexity impacts maintenance, scalability, and the overall total cost of ownership, requiring engineering teams to carefully weigh the benefits of richer context against these operational overheads.
A Decision Framework for Document Intelligence
Before investing in complex multimodal RAG, evaluate the specific needs and characteristics of your documents and use cases. Not every document requires full multimodal processing. Prioritizing where to apply these advanced techniques is crucial for optimizing resource allocation and achieving maximum impact.
Consider the following questions to guide your strategy:
- Is critical information *only* available in tables, charts, or images? (If yes, advanced RAG is essential).
- What is the volume of documents requiring multimodal processing? (High volume increases cost and latency concerns).
- What is the acceptable latency for document ingestion and query response? (VLM processing adds significant delays).
- What is the budget for API calls to multimodal models? (These can be very expensive at scale).
- Are your engineering resources equipped to build and maintain complex, fault-tolerant multimodal pipelines?
- How critical is the accuracy of information extracted from non-textual elements? (High criticality justifies investment).
- Can a simpler approach (e.g., human-curated summaries for key visuals) suffice for high-value but low-volume documents?
Next Steps: Piloting Advanced RAG
Implementing advanced RAG for tables, charts, and images is not a trivial undertaking, but the payoff in enhanced LLM accuracy and broader document intelligence can be substantial. Start with a targeted pilot project focused on a specific document type and a clear set of questions that cannot be answered by text-only RAG. Identify the most critical non-textual data points within those documents and experiment with one or two of the described techniques, such as table re-serialization for structured data or VLM-based captioning for key images.
Evaluate the pilot's performance against predefined metrics, paying close attention to both the quality of LLM responses and the operational costs and latencies incurred. Tools like LangChain and LlamaIndex offer modular components that can help you incrementally build and test these advanced capabilities. By taking a measured, iterative approach, your organization can effectively unlock the full spectrum of information within your enterprise documents, transforming your RAG pipelines from text-limited search engines into true multimodal knowledge systems.
Written by